The FinLab Toolkit

HUMAN CENTERED DESIGN | DEFINE

ERAF Diagram

30 Min

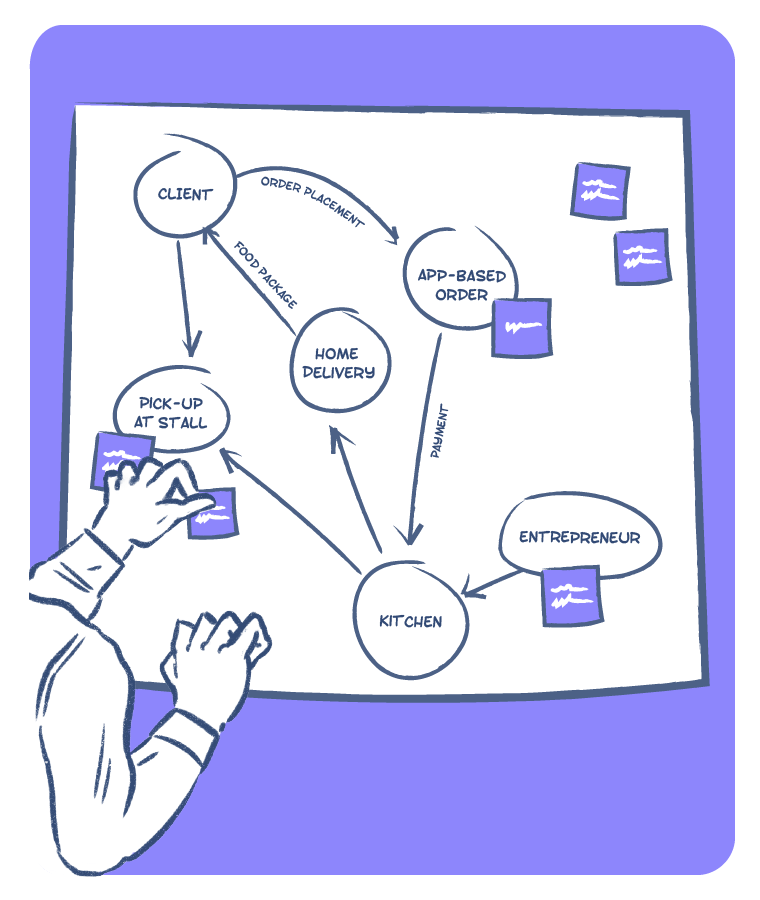
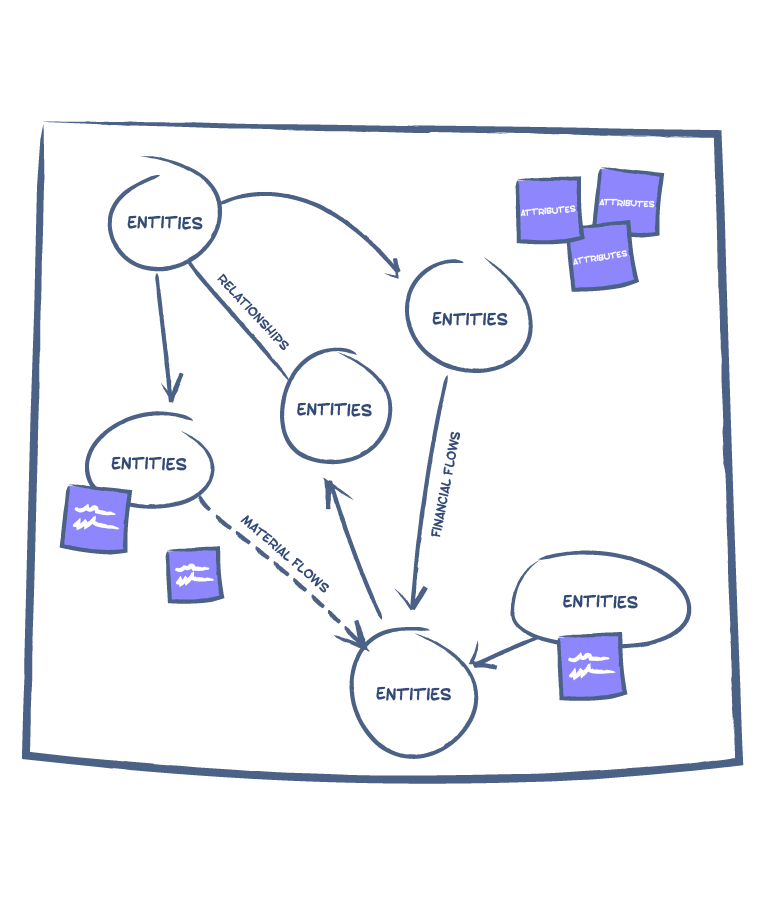
ERAF Diagrams are often referred to as system maps. They are used to represent complex ecosystems that involve multiple Entities (people, organisations, systems) that are connected and therefore in Relationships with each other. Each Entity has a set of Attributes (features, roles, needs). Each Relationship may be described in terms of Flows (financial, material, informational, influence, skills, etc.) from one Entity to another.

USE CASES

  • Visualise a current ecosystem and describe its true nature.
  • Visualise a future ecosystem to imagine its potential nature.

LIMITATIONS

Mapping ERAF Diagrams can get confusing for a system with multiple entities connected to each other.

UNDERSTANDING THE TOOL

  • Entities’ are the core parts and mechanisms of a system. They include users, communities, organisations, institutions, government agencies, etc.
  • Relationships’ describe how entities are connected with one another. They describe the nature of the connection.
  • Attributes’ are characteristics of an entity. Qualitative attributes could be names, brands, perceptions, whereas quantitative attributes could be age, size, cost, duration or any other measurable elements.
  • Flows’ help understand the nature of relationships between entities. They describe the movement of people, material, finance, information, etc. from one entity to another.

STEP BY STEP

  1. Identify entities: List down all entities known to be part of the system (or could be for a future system). Write their names on sticky notes, and park them (on the surface being used).
  2. Define attributes: Describe key attributes of each of the entities, use one or more sticky notes to do this.
  3. Describe relationships: Start connecting entities that are related. Provide space on the board in a way that the connecting lines do not get messy. Describe the relationships on sticky notes — key strengths, weaknesses, etc. As relationships get mapped, move the Entities around to create space. This will ensure the mapping is legible.
  4. Describe flows: Describe specific nature of exchange between entities — human, material, informational, financial, influence, etc.

HOW TO FOR FACILITATORS

  1. At the start: Explain the activity to participants — take them through the different parts of the tool. Depending on whether it is being used for sensemaking to document current systems, or as part of ideation to imagine something new — engage with teams accordingly.
  2. During the exercise: Help participants define various parts of the map, and visualise the map(s) in a clear and organised manner.
  3. At the close: Have participants share their maps, and any interesting insights they may have come up with.

FACILITATORS QUESTION BANK

  • Why do you want to use the ERAF map? Will it help you understand an existing system or imagine a new system?
  • Can you identify all the entities from the system you have studied?
  • What are the attributes or characteristics that can describe the entities?
  • What is the nature of the relationships between the entities? Can you show the connections?
  • After you have connected the entities, which entities are emerging as the most connected and critical?
  • What is the nature of the relationships, what kind of flows are taking place between the entities?
  • Are you capturing all kinds of flows — human, material, knowledge, financial, etc.?
  • Are you using different colours or line types to visualise different kinds of flows?
  • What are your most important learnings from the system mapping? What are some new things you may have learnt?